
Fair, data-backed driver scoring.
Every driver gets a scorecard in their own app, with the events behind it and one or two things to work on. Wrangler.ai does the nudging, so no one on your team has to micromanage.
What's in the box
01
Driver scorecards
A score out of 100 for the last 30 days, with the events behind it.02
Where to focus
One or two habits to work on, each with a plain-language tip.03
Clean-day streaks
Streaks and personal bests drivers actually care about.04
Fair by design
Scaled by miles driven; near misses count only when reviewed.05
Fleet reports
Compare drivers, crews and weeks, and export for insurance.Out of the micromanagement loop
Every score comes from real driving data and trends, so it's fair and nobody has to play the bad guy. Drivers see exactly what counts, own their results and improve on their own. Managers step in only when a pattern doesn't change.Scores based on data, not opinions.
01
Self-coaching
Drivers fix most habits on their own once they can see them.02
Fair and transparent
Everyone knows how the score works and what counts.03
Escalate by exception
Managers get the short list, not every hard brake.01 · In the driver app
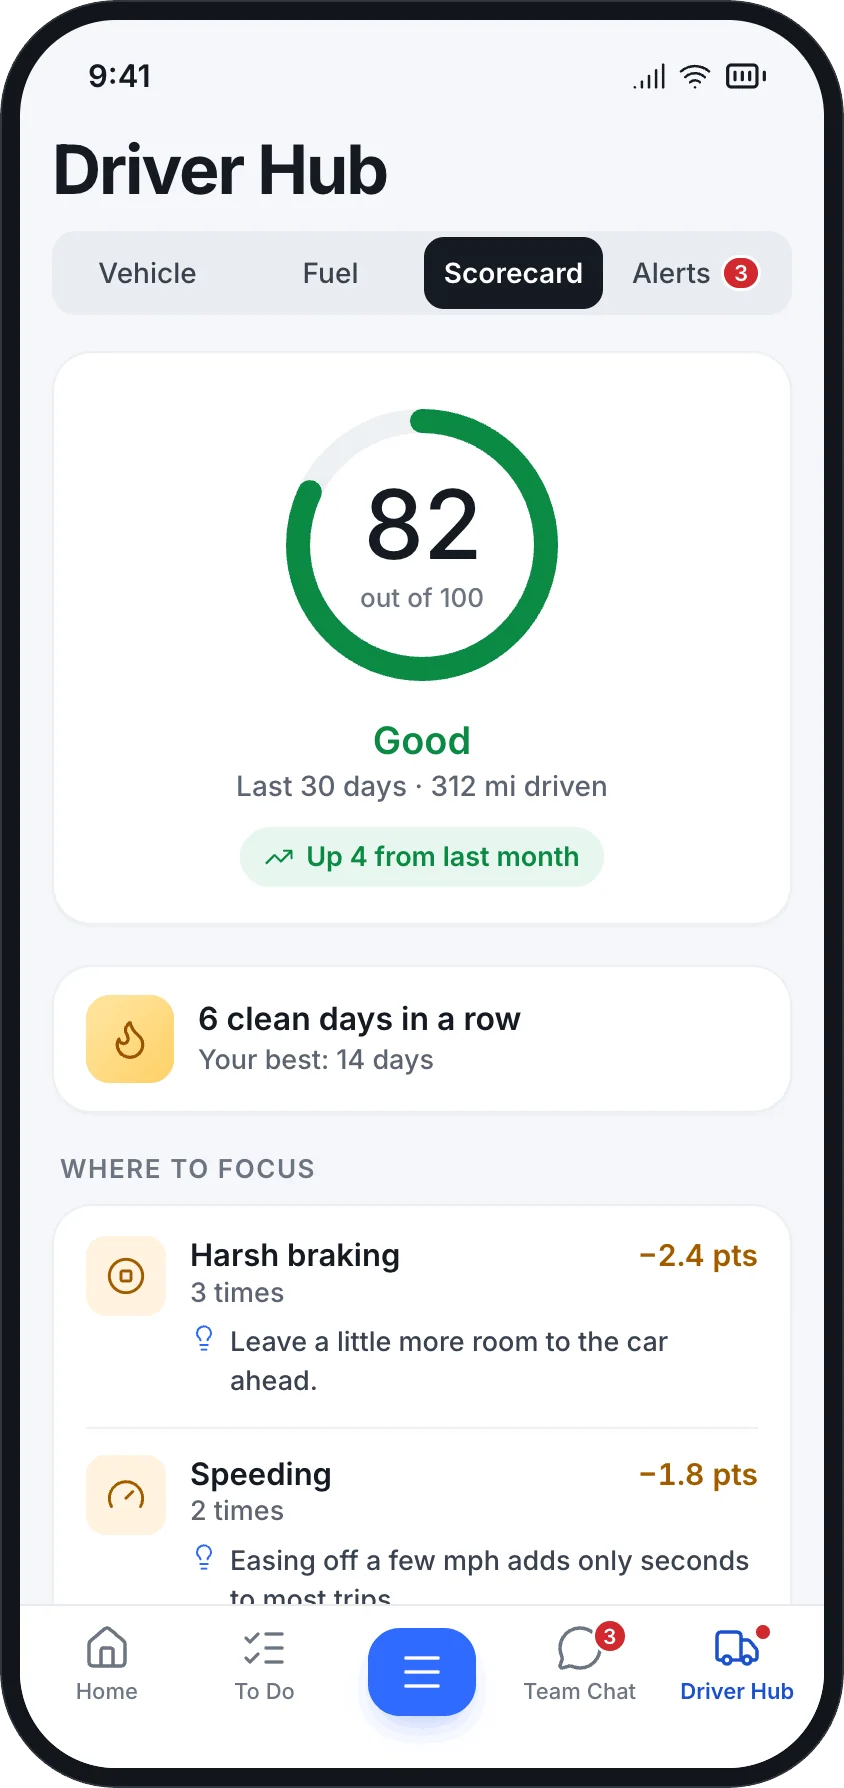
Their score, in their pocket.
Drivers see their score, streak and where to focus right in the Driver Hub, with tips written for people, not analysts.+Score with trend vs last month
+Clean-day streak and personal best
+Recent events with location and speed
02 · How it works
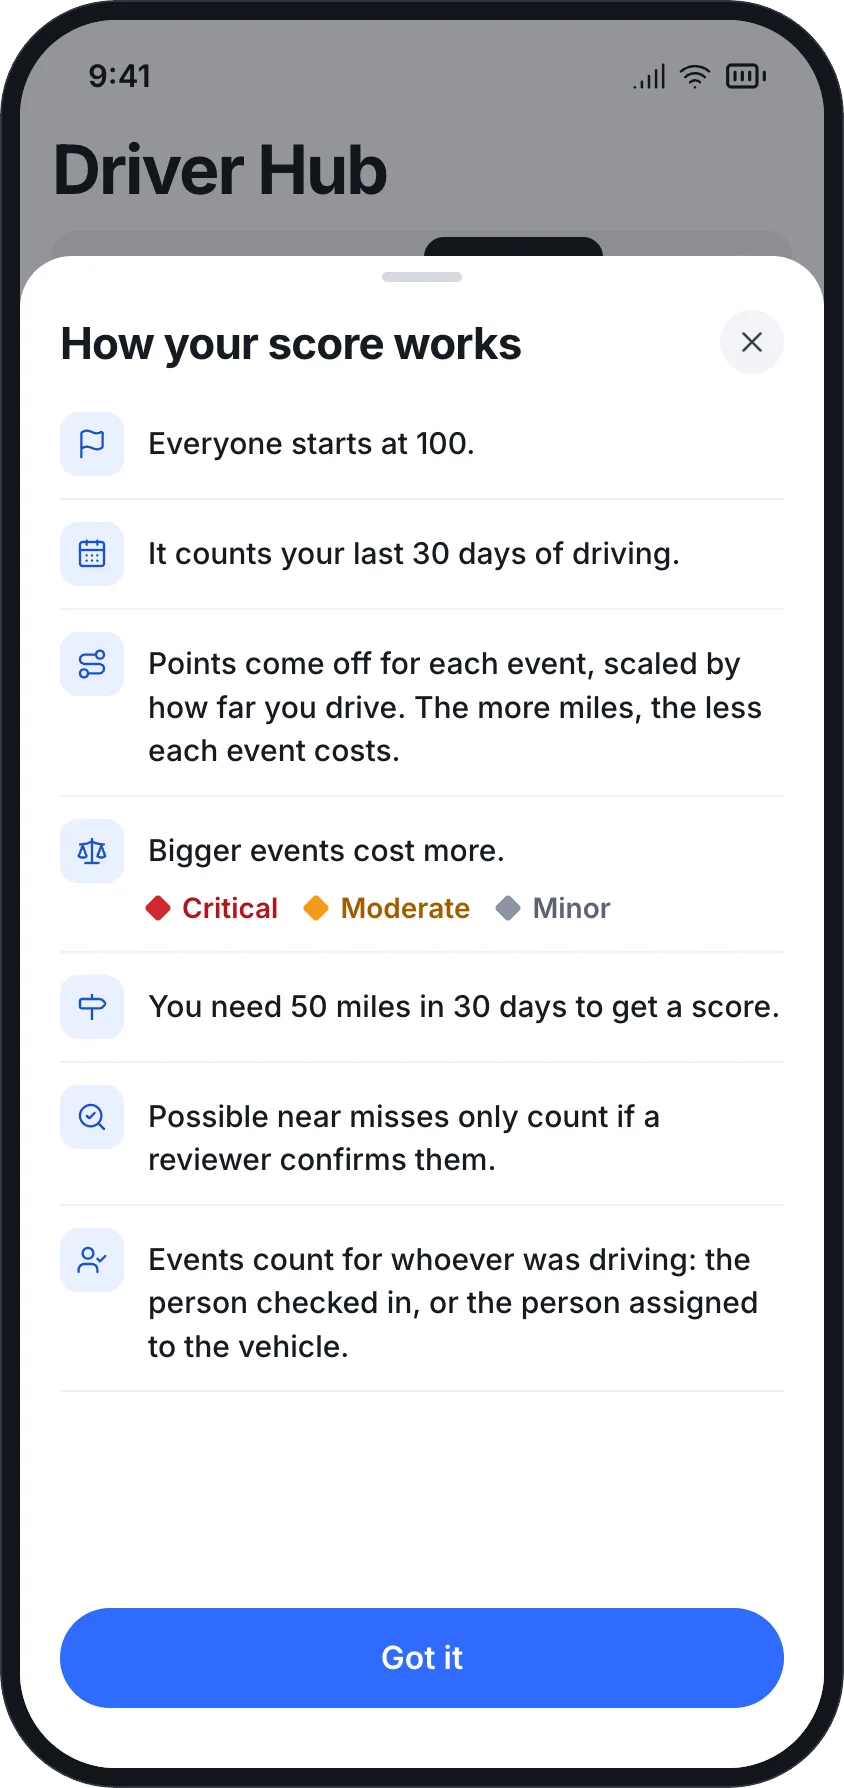
No mystery math.
A plain-language sheet explains exactly how the score is calculated, so nobody argues about fairness.+Everyone starts at 100
+Bigger events cost more; more miles, less per event
+Events count for whoever was driving
03 · For managers
Know where to focus your coaching.
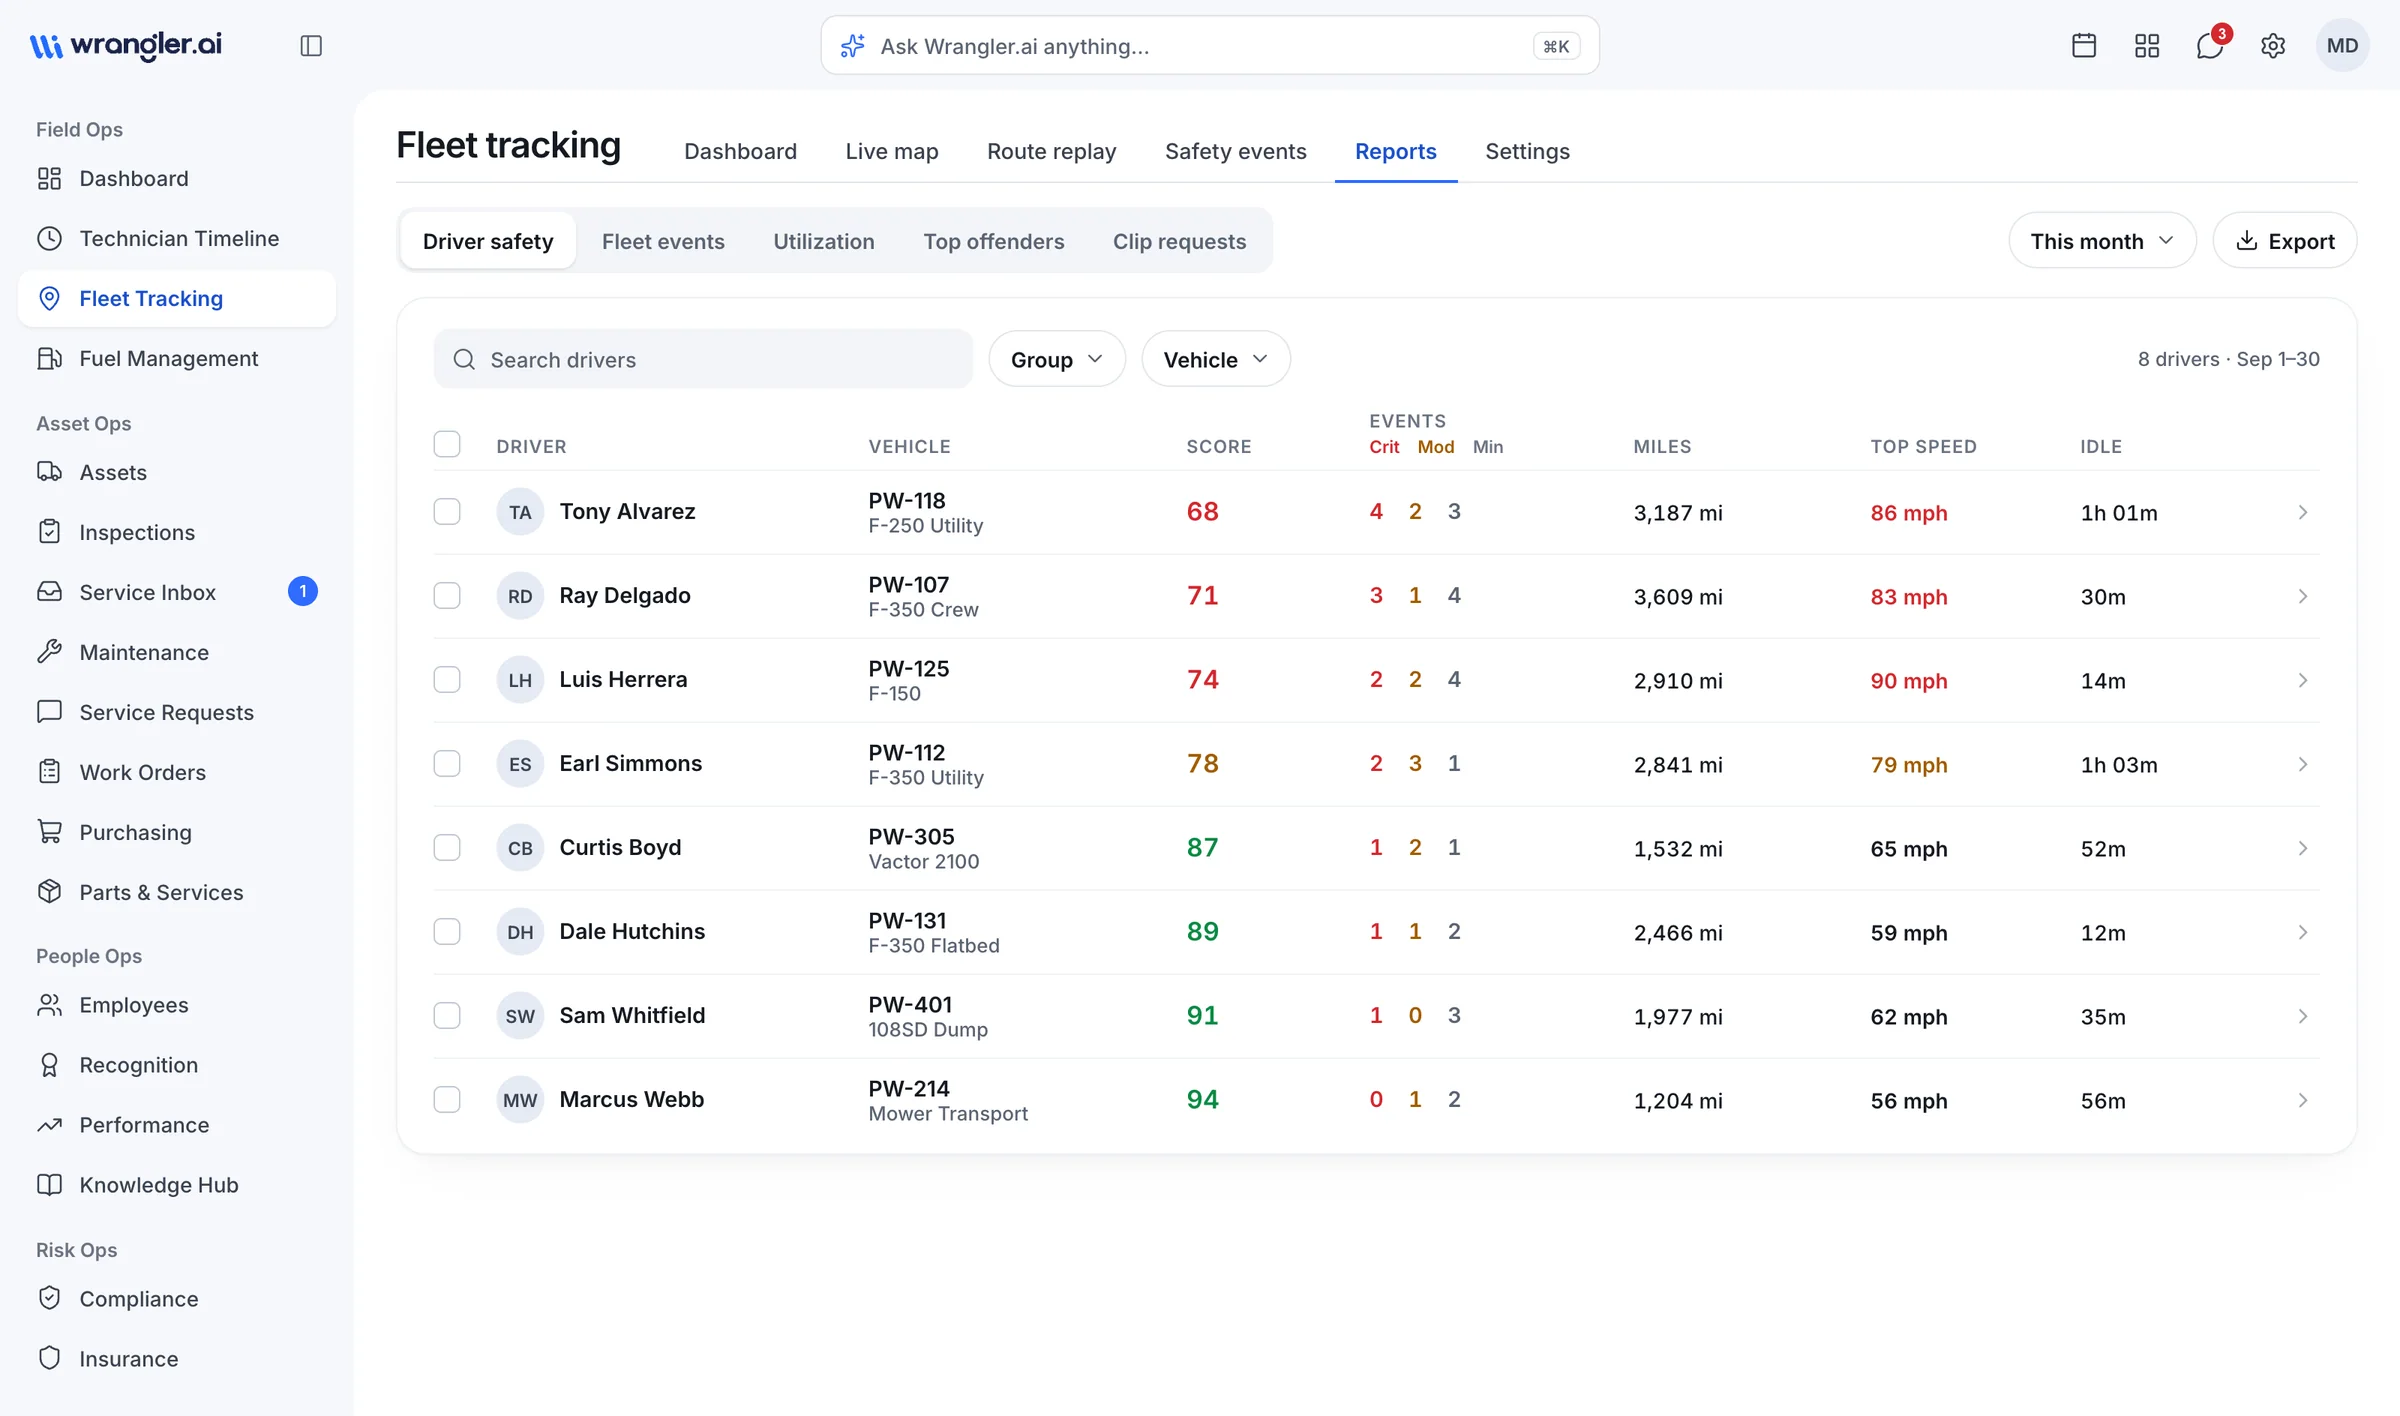
Rank drivers by score and trend, then open the events behind any number.+Score trends by week
+Events per 100 miles
+Custom event weights